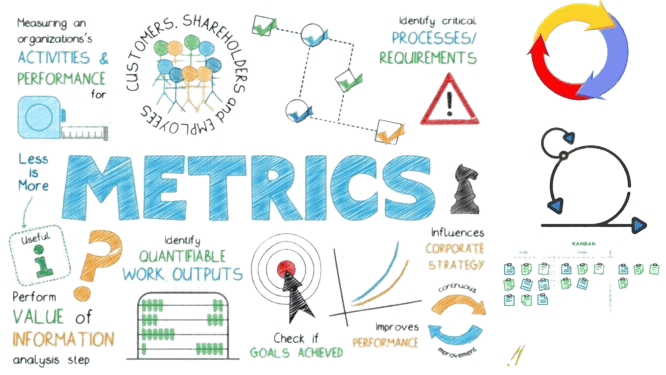
Success in the fascinating world of Agile projects is determined by more than just velocity and burndown charts. As a fervent supporter of efficient project management, I have found that a wide range of additional metrics and Key Performance Indicators (KPIs) offer insightful information on the success of projects. Come along with me as we explore these lesser-known KPIs and measures that go below the surface to help us measure Agile project success in a meaningful way in this article. Prepare to discover an entirely new realm of project management opportunities!
1. Introduction
The way we approach software development has been completely transformed by agile initiatives, which enable teams to be more responsive, flexible, and cooperative. Agile metrics and key performance indicators (KPIs), which offer insightful information on the team’s performance and advancement, are essential to the success of these projects. It is crucial to note that while velocity and burndown charts have historically been the main indicators of success, there are other metrics and key performance indicators (KPIs) that can offer a more thorough picture of project performance. The limitations of velocity and burndown charts will be examined, along with alternative metrics and KPIs. The significance of customization and context will also be covered, along with recommended practices for efficient assessment. By adopting a comprehensive strategy and broadening our toolkit of measurements, we can really measure success in Agile projects.
2. Understanding Agile Metrics and KPIs
What are Agile Metrics and KPIs?
Agile metrics are quantifiable markers that are used to assess the performance and development of Agile initiatives. These metrics provide objective data that can be used to evaluate the effectiveness of the Agile team and identify areas that require improvement. Conversely, specific metrics that align with the project’s goals and objectives are known as Key Performance Indicators (KPIs) and are used to assess the project’s overall success. KPIs and agile metrics are both useful instruments for monitoring and assessing project performance.
Importance of Agile Metrics and KPIs in Project Success:

Agile project success is largely dependent on the use of Agile metrics and KPIs. They give teams information and insights that help them find bottlenecks, make wise decisions, and keep their processes becoming better. Teams may find areas of opportunity, comprehend the project’s development, and make sure it stays on course with the aid of these measurements and KPIs. Teams can guarantee they are providing value to the client, optimize procedures, and handle concerns quickly by having a comprehensive picture of project performance.
3. Limitations of Velocity and Burndown Charts
Velocity as a Measure of Success:
In Agile projects, velocity-which is frequently expressed in story points-is a widely used metric to gauge how much work is finished in each iteration. It offers a numerical indicator of the group’s output and capacity to satisfy the needs of the client. But using velocity as the only indicator of success can be deceptive. Although velocity may be a good indicator of the team’s productivity, it is not always a good indicator of the caliber of work produced or the effect it has on the client.
Drawbacks of Relying Solely on Velocity:
Many variables, including shifts in the makeup of the team, outside dependencies, and even the difficulty of the task at hand, can have an impact on velocity. As a result, comparing the velocity of different teams or iterations could not give a reliable indication of performance. Furthermore, value supplied to the customer is not included in velocity, despite it being a crucial component of project success. Strictly depending on velocity may cause deliverables to be hurried and of poor quality as a result of an emphasis on speed above quality.
Issues with Burndown Charts:
Another indicator that is frequently employed in Agile projects are burndown charts. They offer a visual depiction of progress and keep track of the work that has to be done on the project. Burndown charts have limits even though they might be useful in determining whether the team is on track to reach the project deadline. The intricacy of the job being done, the caliber of the deliverables, or the customer’s happiness are all not represented by burndown charts. They offer a constrained perspective on the status of the project and shouldn’t be the exclusive indicator of success.
4. Exploring Alternative Metrics and KPIs
Customer Satisfaction:
One important indicator of end users’ or stakeholders’ contentment and happiness is customer satisfaction. Through evaluations, feedback sessions, or questionnaires, it can be quantified. Teams may make sure they are satisfying consumers’ demands and providing value by proactively seeking out their feedback. Customer satisfaction is a useful statistic because it concentrates on the project’s main objective, which is to deliver a solution that both meets and exceeds the customer’s expectations.
Cycle Time:

Cycle time is a measure of how long a task or user story takes to complete from beginning to end. It offers information about how well the team works together and how quickly the work is finished. Teams may find bottlenecks and simplify their operations by monitoring cycle time, which will ultimately result in faster and more reliable work delivery. Cycle time is a crucial measure since it emphasizes work flow and aids teams in streamlining their delivery procedures.
Team Happiness:

The level of contentment, engagement, and morale among team members is measured by team happiness. Teams that are content and motivated are more likely to work efficiently together, produce excellent work, and be productive. Through consistent team satisfaction surveys, leaders may spot possible problems, resolve them, and foster a healthy work atmosphere. Since it acknowledges the significance of the individuals completing the work and their influence on the project’s success, team happiness is an important statistic.
Quality Metrics:
The team’s deliverables’ quality is gauged via quality measures. Metrics like the quantity of errors or defects discovered during testing, the degree of code coverage, or the frequency of code reviews might be included in this. Teams may make sure that they are producing work that is dependable, maintainable, and up to the required standards by monitoring and enhancing these quality measures. Since quality metrics concentrate on the project’s long-term viability and success, they are essential.
Business Value Delivered:
The effect of the work on the company or organization is measured by the business value delivered. It focuses on the anticipated results and advantages of the project, including higher sales, better customer happiness, or cost savings. Teams may make sure that they are delivering value to stakeholders and aligning their work with the organization’s strategic objectives by monitoring and measuring the business value they offer. A critical statistic that links the project’s goals with its effects on the business is business value delivered.
Lead Time:
Lead time is a metric used to quantify how long it takes a job or user story to go from the backlog to production. It offers information about the effectiveness of the team’s delivery procedures as well as the rate at which the client receives work. Teams can increase their agility, reactivity, and time-to-market by cutting lead times. Lead time is a crucial measure since it emphasizes the delivery process from beginning to end and aids in the identification of areas for team improvement.
Escaped Defects:
The quantity of flaws or problems discovered in the production environment after release is measured by escape defects. This measure sheds light on the caliber of the outputs as well as the efficiency of the team’s testing and quality control procedures. Teams can ensure that their software satisfies the required standards by increasing the software’s stability and reliability through the tracking and reduction of fugitive faults. Escaped flaws are an important metric because they show the caliber of the job that is being provided to the client.
Employee Engagement:
Employee engagement gauges how motivated, committed, and contented team members are. Employees that are engaged in the project are more likely to be dedicated to its success, innovative, and productive. Leaders may establish a productive workplace, encourage teamwork, and raise the performance of the entire team by routinely monitoring and enhancing employee engagement. Since employee engagement acknowledges the value of the people who propel a project ahead, it is an essential statistic.
Predictability:
The team’s ability to precisely estimate and complete tasks within the allotted time limits is measured by predictability. It offers perceptions into the group’s dependability and capacity for keeping promises. Teams may become more trustworthy, better at managing expectations, and forge closer bonds with stakeholders by increasing predictability. Since predictability shows the team’s capacity to provide value on a regular basis, it is a crucial statistic.
Throughput:
The quantity of work the team completes in a specific amount of time is measured by throughput. It gives information on the team’s output and capacity to satisfy the needs of the client. Teams may optimize their workflows, find bottlenecks, and guarantee a smooth flow of work by monitoring and enhancing throughput. Because it emphasizes the team’s capacity to complete tasks quickly, throughput is an important performance indicator.
5. Importance of Context and Customization
Adopting Metrics and KPIs Aligned with Project Goals:
It’s critical to match measurements and KPIs chosen for Agile projects with the aims and objectives of the project. Every project is different, posing different obstacles and requiring different stakeholders. Teams may make sure that they are assessing the appropriate components of performance by implementing metrics and KPIs that are directly tied to the project goals. Metrics like code coverage or defect density, for instance, may be given priority in a project that focuses on quality, whereas metrics like cycle time or lead time may be given priority in a project that focuses on time-to-market.
Challenges in Selecting and Implementing Custom Metrics:
Although they might offer insightful information about the effectiveness of a project, custom metrics can also be difficult to use and interpret. Clear definitions, procedures for gathering data, and techniques for analysis are necessary for custom metrics. Ensuring that team members have a shared understanding of the measurements and are working towards the same objectives is crucial. Furthermore, gathering and tracking the relevant data for custom metrics could take more time and money. It’s critical to assess the advantages and disadvantages of introducing custom metrics and make sure the project will benefit significantly from them.
The Role of Continuous Improvement:
When choosing and implementing measurements and KPIs, continuous improvement is essential. Regularly reevaluating and adjusting the metrics in use is crucial when projects, goals, and circumstances change. Teams should proactively seek out feedback, absorb lessons from past mistakes, and modify KPIs and measurements as necessary. Teams may make sure they are measuring the appropriate things and efficiently tracking their progress toward project success by adopting a continuous improvement culture.
6. Overcoming Challenges in Measuring Success
Clear Communication and Alignment:
To overcome obstacles in success measurement, clear communication and alignment are essential. A shared knowledge of the measurements and KPIs being employed, as well as their importance and interpretation, is crucial. Teams may make sure that everyone is aiming for the same goals by outlining the metrics’ purpose and goals in plain terms. In addition to addressing any misunderstandings or worries, regular communication and alignment meetings can promote a sense of shared accountability and ownership.
Real-Time Data Collection and Reporting:
Effective measuring requires real-time data collecting and reporting. Postponing data collection and analysis till the end of a project or iteration might result in missed possibilities for improvement and delayed insights. Teams are able to see problems early on, take rapid action to resolve them, and make proactive decisions when they gather and report data in real-time. Agile solutions, like project management software or dashboards, which automate the data collecting and visualization process, can help to enable real-time data reporting and collection.
Integrating Metrics into Retrospectives:
Retrospectives offer a priceless chance to consider the project, pinpoint areas that need work, and establish action items. Teams can examine data, spot trends or patterns, and get valuable insights by including metrics into retrospectives. They are able to create clear improvement goals, monitor their progress over time, and make well-informed decisions as a result. Metrics integration into retrospectives guarantees that the team is always improving and learning, and that measurement is a crucial step in the process.
Avoiding Overemphasis on Individual Metrics:
indicators and KPIs are valuable tools, but it’s critical to avoid prioritizing some indicators over others. The success of a project has multiple dimensions that cannot be measured by a single KPI or metric. It’s critical to take into account a variety of measures that offer a comprehensive picture of performance and to comprehend how they interact with one another. Teams may make sure they are capturing the complexity of project success and making well-informed decisions based on a comprehensive understanding by avoiding placing an excessive amount of emphasis on specific indicators.
Using Agile Tools to Automate Data Gathering:
Agile solutions can be very helpful in lowering manual labor, automating the data collection process, and guaranteeing data veracity. Task trackers, dashboards, and project management software can help with the gathering and display of measurements and KPIs so that teams can concentrate on analysis and interpretation. Teams may save up time and resources and make sure that measurement becomes an integrated and seamless part of their workflow by automating data collection with Agile technologies.
7. Best Practices and Tips for Effective Measurement
Setting Clear Goals and Objectives:
Effective measuring requires well-defined goals and objectives. Teams can choose measurements and KPIs that are in line with their goals by outlining their objectives explicitly. SMART stands for specified, measurable, achievable, relevant, and time-bound goals, and they should give a project’s success a clear path. Teams can monitor progress, keep tabs on performance, and make well-informed decisions when they have clear goals and objectives.
Selecting Appropriate Metrics and KPIs:
Effective measuring requires careful consideration of the measurements and KPIs that are chosen. The project’s particular requirements, objectives, and context should all be taken into account while choosing metrics. Teams can make sure they are measuring the correct things by determining the essential components of project performance and the metrics that capture these components. It’s also critical to choose metrics that are meaningful, practical, and simple for the team and stakeholders to understand.
Regular Monitoring and Review:
Effective measuring requires frequent observation and analysis. Teams can find trends, patterns, and opportunities for improvement by routinely monitoring and reviewing metrics and KPIs. Teams may make sure that measurement becomes a continuous and integrated part of their process by setting up a cadence for monitoring and review. Teams are also able to take prompt corrective action, recognize accomplishments, and continually learn and adapt when they conduct regular monitoring and evaluation.
Creating Transparency and Visibility:
For measurement to be effective, metrics and KPIs must be made visible and transparent. The measurements ought to be available to and understandable to every member of the team. Teams develop a culture of accountability, cooperation, and shared ownership of project achievement by establishing transparency and visibility. Dashboards and reports that visualize metrics can improve visibility and encourage dialogue about performance.
Involving Stakeholders in the Measurement Process:
Effective measuring requires including stakeholders in the process. Stakeholders offer insightful opinions and viewpoints, and their involvement may guarantee that the appropriate KPIs and measurements are being applied. Teams may foster a sense of ownership, better align their efforts with stakeholder demands, and increase project success by including stakeholders in the measuring process. Maintaining consistent communication and cooperation with stakeholders can aid in validating the selected metrics and guarantee that they offer significant benefits.
8. Case Studies: Successful Implementation of Alternative Metrics
Using Team Happiness as a Metric:
In this case study, a software development team chose to use team satisfaction as a key performance indicator for the project. To determine the level of happiness and engagement among team members, they periodically hosted team feedback sessions and anonymous survey campaigns. By concentrating on team satisfaction, the group resolved issues, found opportunities for growth, and established a productive workplace. As a result, there was an uptick in output, teamwork, and client satisfaction, which finally led to a successful project conclusion.
Incorporating Business Value Delivered:
An Agile team used business value delivered as a project success metric in this case study. They tracked key performance measures like revenue growth, client acquisition, and cost savings to quantify the project’s impact on the company. The team made sure they were producing a favorable return on investment and adding value to the stakeholders by coordinating their work with the organization’s strategic objectives. As a result, the team saw long-term success, sustained investment in the project, and higher stakeholder satisfaction.
Implementing Quality Metrics:
A software development team used quality measurements in this case study to gauge the project’s progress. Metrics including defect density, code coverage, and customer feedback were monitored and examined. Quality-focused thinking allowed the team to spot possible problems early in the development process and fix them, which produced deliverables of a higher caliber and happier customers. This ultimately resulted in better business outcomes, positive word-of-mouth, and higher client retention.
9. Conclusion
To sum up, Agile projects necessitate a mentality change as well as the use of metrics and KPIs that offer a thorough grasp of project success. Even while velocity and burndown charts have historically been the main measurements, it’s critical to understand their limitations and look into alternate KPIs and metrics. Customer satisfaction, cycle time, team satisfaction, quality metrics, lead time, escaped defects, employee engagement, predictability, and throughput are a few examples of metrics that can give important information about how well a project is performing. Effective measurement requires customization, context, unambiguous communication, real-time data collecting, and ongoing development. Teams can measure the effectiveness of Agile projects, make educated decisions, and constantly improve their processes by adopting a holistic approach and choosing relevant metrics and KPIs.


